What is the Overall Experience Score (OES)?
The Overall Experience Score (OES) is an innovative methodology for measuring and managing customer and employee experience, developed by InsightSofa. This methodology uses artificial intelligence to analyze the entire survey, including all questions and answers, to assign an overall survey rating on a scale from 0 to 10. Unlike traditional methodologies like NPS, CES, or CSAT, which focus on a single question, OES provides more detailed and accurate data for managing companies. More information about this methodology can be found here.
How does the Overall Experience Score work?
InsightSofa’s artificial intelligence analyzes surveys by reviewing all questions and answers from the collected survey. Based on this analysis, it assigns several ratings on a scale of 0 – 10 for each survey, from the perspectives of:
- Customer and employee satisfaction
- Likelihood of customer and employee recommendation
- Ease of interaction with the company
- Relationship with the company (loyalty)
Thus, each completed survey receives 4 OES Scores on a scale from 0 to 10:

Overall Experience Score Trend Report – What is it used for?
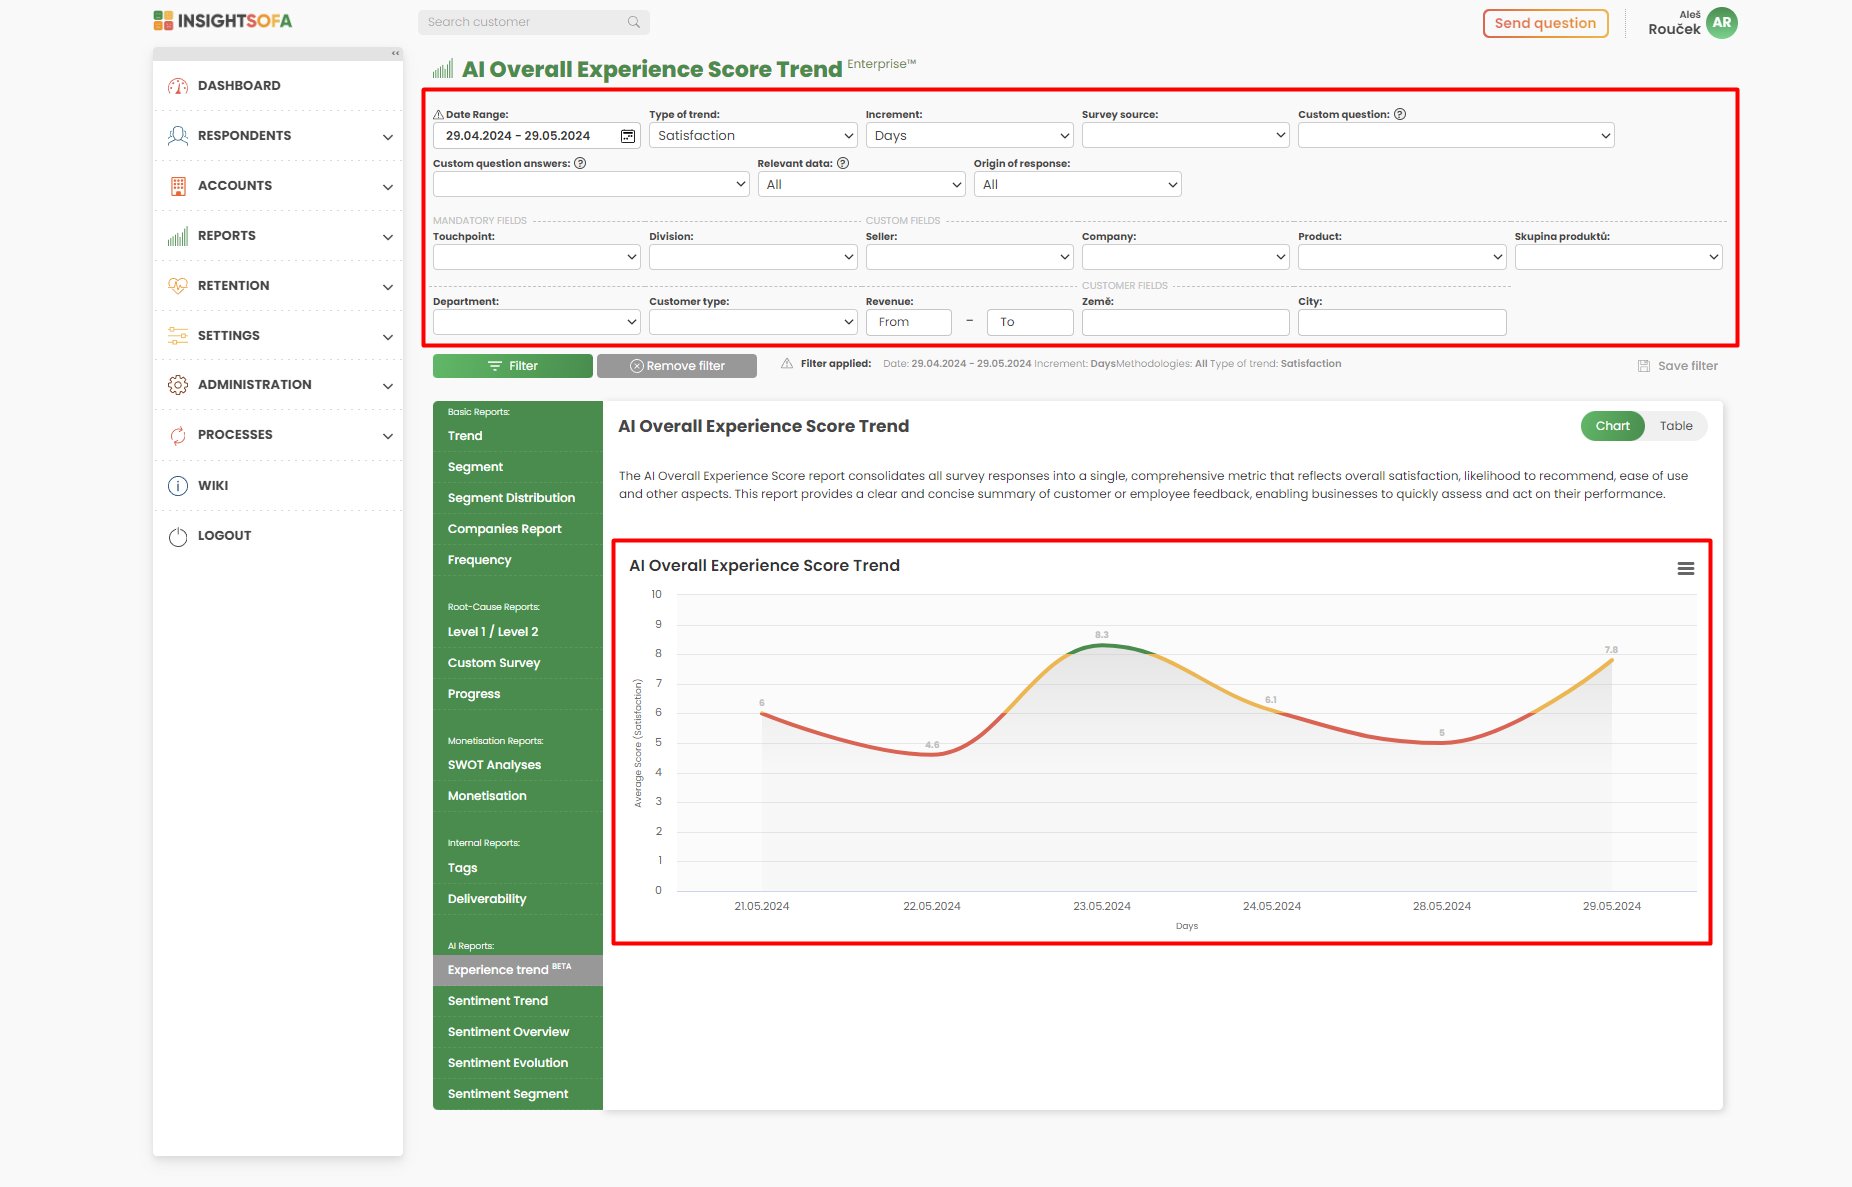
The Overall Experience Score (OES) methodology revolutionizes the measurement and management of customer and employee experience. By analyzing the entire survey and assigning ratings based on this, it is the most accurate methodology currently available. The OES Trend Report displays the development of the overall customer opinion over time, and can be viewed from the following perspectives:
- Customer and employee satisfaction
- Likelihood of customer and employee recommendation
- Ease of interaction with the company
- Relationship with the company (loyalty)

For example, if you select the perspective of “Customer Satisfaction,” the OES Trend Report will show the development of your customers’ overall satisfaction based on all the feedback they provided (including sentiment analysis).
The Overall Experience Score trend report can be tracked for the entire company or for specific segments. While the report for the whole company provides a “big picture” overview, segments are more useful for managing the company (e.g., what is the sentiment for a particular product, personnel, country, region, etc.?). Filters above each InsightSofa report allow you to display the specific segment you want to monitor.
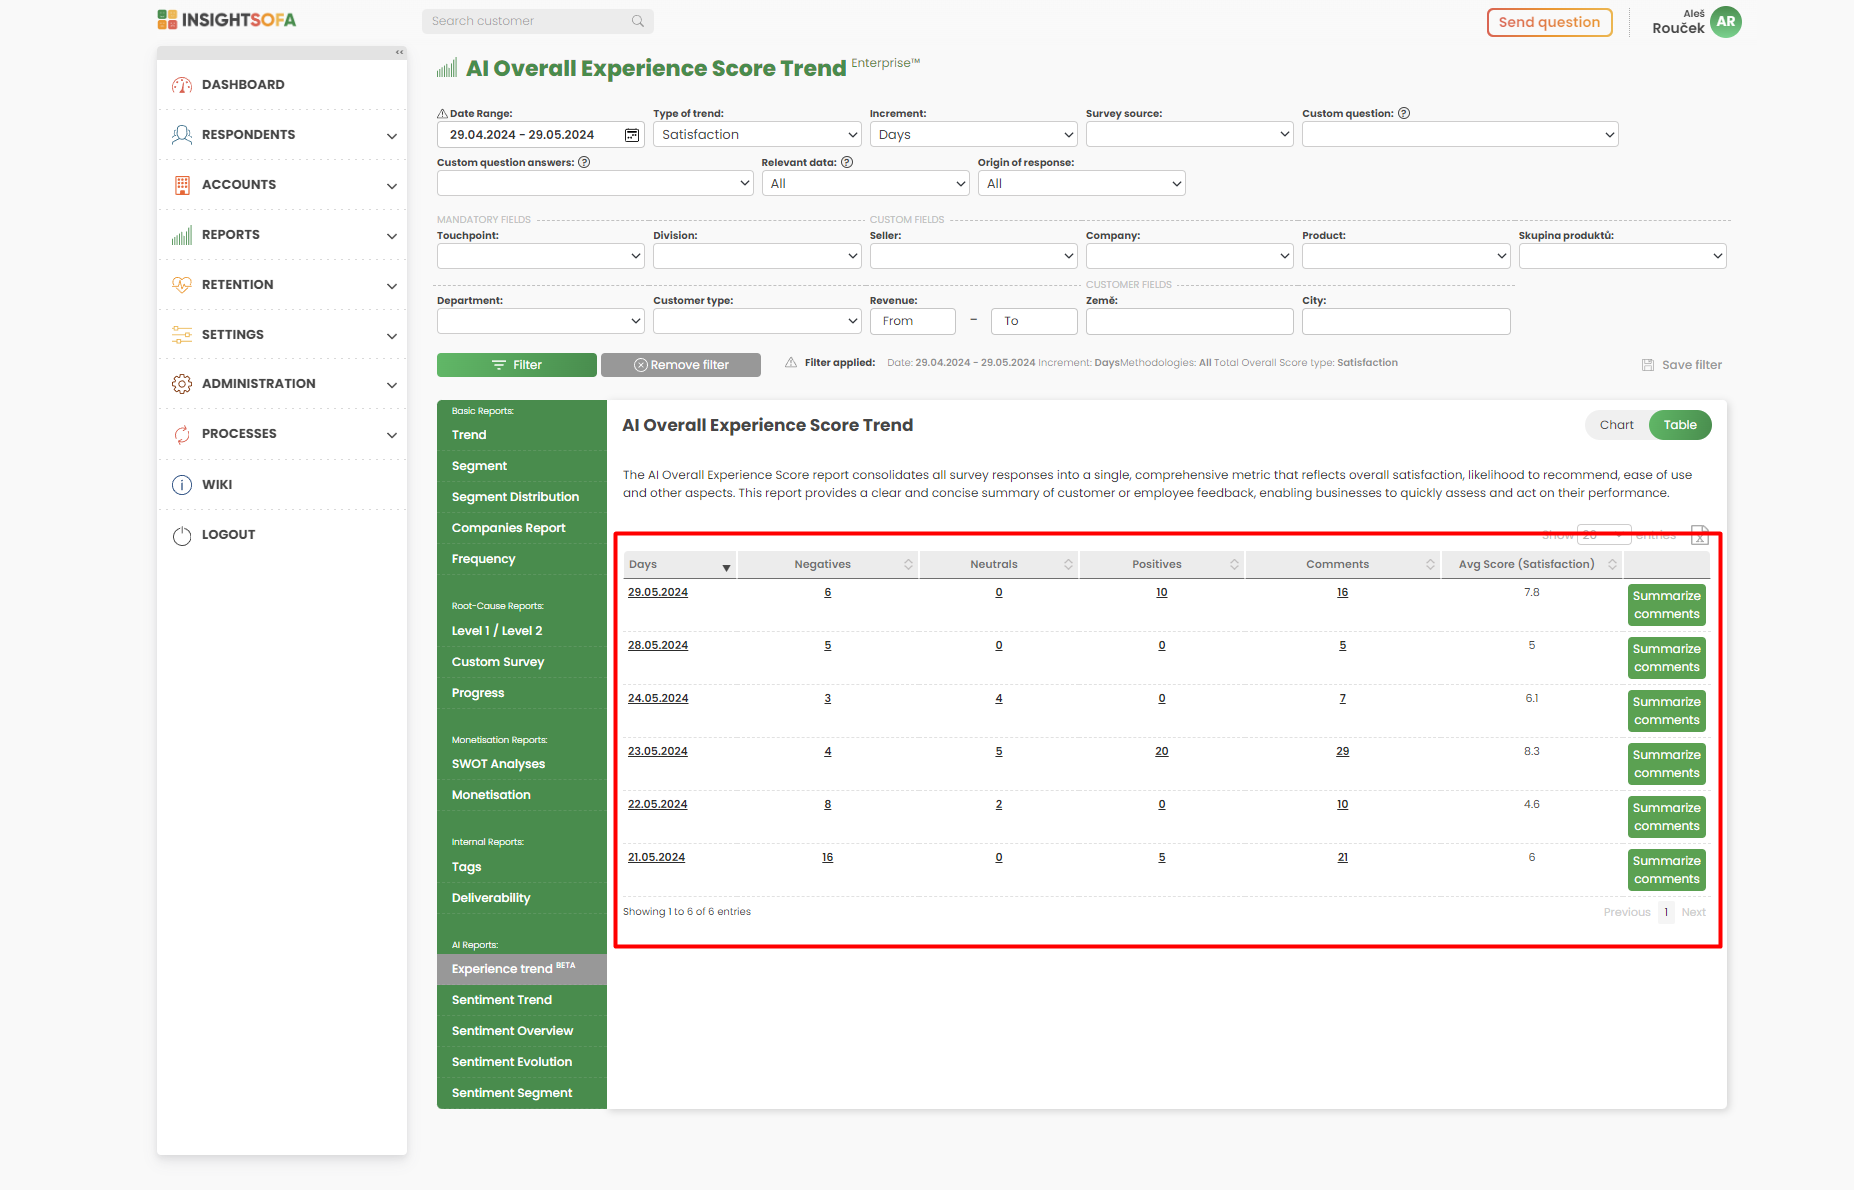
Like all InsightSofa reports, the OES Trend Report includes a tabular section that helps you work with precise data or export results to Excel.

For each displayed segment, you can generate a summary with one click, showing what respondents are most concerned with, as well as your strengths and weaknesses for that segment.

